
WAS BAD BUNNY THE RIGHT CHOICE FOR
THE SUPER BOWL HALFTIME SHOW?
sentiment analysis: what do people think about bad bunny being
chosen to perform at the super bowl halftime show?
You've seen the Spotify data.
but what about YouTube?
With the largest focus group in the world.
ABOUT THIS RESEARCH
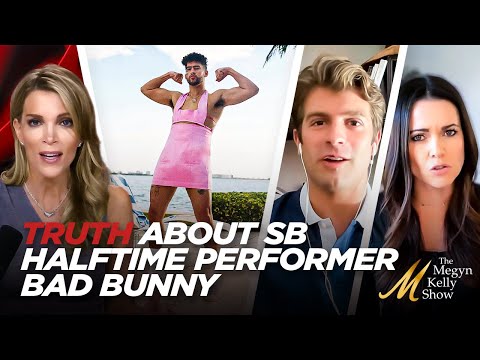
On September 28, 2025, Bad Bunny was announced as the Super Bowl LX halftime performer. The response was immediate and intense. Fans celebrated. Critics pushed back. Debate unfolded publicly across channels and communities.
This research exists to understand those reactions at scale. Spotify streaming numbers show how many people listen. They do not show how people interpret, debate, or respond to an artist’s presence in culture.
But what about YouTube? Mobile reach data shows YouTube reaching 74% of Americans, compared to 38% for Spotify.
For this study, we used Touchstorm DATAlabs’ proprietary YouTube intelligence to analyze 1,227,653 videos and 41,315 comments to examine how Bad Bunny really shows up in conversations around the Super Bowl.
We’re going beyond streaming numbers and music video views to understand what people are actually saying.
Was Bad Bunny the right choice?
BACKGROUND
Touchstorm DATAlabs is a private, woman-owned, self-funded subsidiary of Diginary Holdings, LLC. It’s a sister company to Touchstorm, our managed services company that runs YouTube channels for some of the world’s biggest brands. DATAlabs customers include Google, Amazon, ClickUp, Exness and Mozilla. Touchstorm clients include Toyota, T-Mobile, J&J, Bosch, various media companies and brands owned by multinational marketers including P&G and Bacardi. We’ve been in business nearly 30 years.
Touchstorm DATAlabs has a singular ability to transform YouTube into the World’s Largest Focus Group, revealing societal perceptions and marketing insights impacting any conceivable human activity, anywhere. By replicating, structuring and appending YouTube’s database, we enable YouTube Social Listening, Custom Perceptual Studies (like our Political “Polls”), Behavioral & Trend analysis, Competitive Tracking, Influencer Analysis and Automation, eCommerce Reviews, APIs for data aggregation and ratings for unrated industries like gaming, music & podcasting. We also offer a SaaS platform for anyone looking to improve their YouTube performance.
METHODOLOGY
Our process begins with the daily import of every new video uploaded to YouTube—approximately 5 million per day. Each night, these videos are ingested into our database alongside ~40 standard metrics provided by YouTube, which are subsequently refreshed daily.
We then sort and categorize videos according to the Touchstorm Video Index (TVi), our proprietary taxonomy. The TVi houses approximately 200,000 nested Topics that cover every aspect of the human experience in granular detail.
To determine our competitive set, we selected the top artists in the US and globally based on streaming data from major platforms across 2024 and 2025. We also included select US country artists who are particularly relevant in the current pop culture climate.
To measure artist popularity, we analyzed data for the one-year period leading up to the announcement (September 28, 2024 – September 28, 2025). For sentiment metrics, we analyzed the nine weeks (approximately two months) following the announcement (September 28, 2025 – November 29, 2025).
Content is segmented into “Owned” and “Earned” categories:
- Owned: Content belonging to the artists themselves, found on their Official Artist Channel (OAC). The OAC consolidates uploads from the artist’s various topic channels and VEVO channels.
- Earned: Videos created about or featuring the artist by third-party creators. This metric reveals how often others talk about, feature, clip, remix, debate, or reference an artist. It measures “cultural bandwidth” rather than just distribution budget.
To evaluate video sentiment at scale, we employed AI models to analyze video contents and assess the tone of the content. Manual human review was conducted for high-view-count videos to correct instances where AI might make mistakes in detecting nuance, such as sarcasm or satire.
We utilized proprietary technology to compile comments, then applied third-party AI to go beyond basic sentiment analysis. By generating unique confidence and relevance scores for every comment, we were able to separate low-information noise from the highly relevant, nuanced feedback critical to this study.
For questions regarding our data sources, taxonomy, or AI modeling, please contact us at badbunnyreport@touchstormDATALabs.com
COMPETITIVE ANALYSIS: HOW DOES BAD BUNNY COMPARE TO OTHER ARTISTS ON YOUTUBE?
WHICH ARTIST HAS THE LARGEST SHARE OF VOICE?
This data represents views from videos about each artist, excluding all official content. This tells us how much other people talk about, feature, clip, remix, debate, or reference each artist. It’s less “who spent more on music video distribution,” more “who occupies the most cultural bandwidth”.
Bad Bunny trails only Bruno Mars in Longform content consumption, ranking as the #2 artist both globally and in the US While he holds a strong 8.64% share worldwide, his dominance peaks in the United States, where he commands a significant 12.02% of all views in the category.
Bad Bunny is more “viral” outside of the US. His Shorts share in Global Except US (3.07%) is more than 4 times higher than his Shorts share in the US (0.73%). In the US, he is almost exclusively a Longform artist.
Sabrina Carpenter is the #1 artist in the US overall, but this is driven by her #1 spot in Shorts (15.9%). In Longform, she is only #13. Bad Bunny (12%) actually has nearly 4x the share of Sabrina (3.2%) in Longform content.
Bruno Mars is the only artist who truly outclasses Bad Bunny in his own specialty. Bruno is the #1 artist in Longform across every region, including a staggering 46% share of the Global Except US Longform market.
Source: Touchstorm DATAlabs
Note: Data reflects “earned” content (videos about/featuring each artist) from the year prior to the 9/28/25 announcement.
WHICH ARTIST HAS THE BEST PERFORMING CONTENT?
This data represents views from videos on each artist’s Official Artist Channel (OAC), including all official content.
Bad Bunny holds the largest share of views among all artists (20.13%), with a total of 1.4B views. He has 6 videos in the Top 20 with the most views, ranking at #2, #13, #15, #16, #17, and #18.
Bad Bunny’s strategy consists of releasing visualizers for every track on his most recent album plus a few music videos. This allows him to dominate the total view share without needing to pivot to short-form content.
Other top artists (Taylor Swift, Lady Gaga, Sabrina Carpenter) typically only release visuals for 3–5 key singles, leaving the rest of the album as static “Art Tracks” which generate fewer views. Their content often includes “Behind the Scenes,” “Teasers,” and “Fan Challenges” (via Shorts).
While Bad Bunny has one massive hit (“BAILE INoLVIDABLE” with 333M views, the #2 video overall) This top video only accounts for 23% of his total views, meaning over 1.1 billion views come from the rest of his recent content.
While Bad Bunny dominates via long-form, the #2 artist Alex Warren (~969M views) utilizes a completely different strategy, with 4 of his top videos being Shorts that each exceeded 100 million views.
Morgan Wallen has more than double the video count of Bad Bunny (68 vs. 30), yet Bad Bunny has nearly 4x more views.
Source: Touchstorm DATAlabs
Note: Data reflects “owned” content from artists’ official channels from the year prior to the 9/28/25 announcement.
WHICH ARTIST HAS THE MOST VIDEOS MADE ABOUT THEM?
Taylor Swift is in a league of her own regarding the number of videos made about her (181k videos). However, she ranks 3rd in total views, indicating that while she has a massive “army” of creators, individual video performance is lower on average compared to others. Videos about Taylor Swift have a very specific commonality: Fan Engagement and the Eras Tour.
Bruno Mars is the ultimate outlier for total views (10.4B). He achieves this with significantly fewer videos (68k) than Taylor Swift, leading to the highest Views per Video (153k) in the dataset. Bruno Mars’ massive success in “not-owned” content is almost entirely driven by high-profile collaborations like “APT.” on ROSÉ’s channel (over 2.2B views)
Videos about Ariana Grande rarely focus on her music. Her top 10 YouTube videos are mostly personality-driven clips (e.g., interactions with Jimmy Fallon, her fastest acceptance speech) with only one singing clip (a clip from Wicked).
Bad Bunny’s lower video count (34k vs Taylor’s 180k) is due to less “memeable” content for Shorts (Bad Bunny: 145 Shorts; Taylor Swift: 821 Shorts). However, his Longform videos are more efficient, averaging 10.8M views (nearly double Taylor/Ariana’s top videos). Which is due to the top videos being mostly Lyric Videos.
Source: Touchstorm DATAlabs
Note: Data reflects “earned” content (videos about/featuring each artist) from the year prior to the 9/28/25 announcement.
THE MOMENTUM SHIFT (PRE VS. POST ANNOUNCEMENT)
WHICH ARTIST HAD THE MOST CONTENT MADE ABOUT THEM POST ANNOUNCEMENT?
Videos Per Week Growth
The announcement of Bad Bunny as the halftime performer didn’t just spark sports conversations; it triggered a massive wave of political content. Pre-Announcement: The videos were standard music fanfare—topics included “Concierto” (Concert), “Puerto Rico,” “Residencia,” etc. Post-Announcement: The top keywords exploded into “Super Bowl,” “Trump,” “Halftime,” and “NFL.”
Luke Bryan (+183%) and Chris Stapleton (+163%) saw the largest percentage growth in video volume, even outpacing Bad Bunny’s growth rate. This surge was not related to the Super Bowl. It was driven by the 2025 CMA Awards (performances of “Bad As I Used To Be”) and seasonal releases like “Winter Wonderland.”
Luke Bryan’s high volume stems from viral clickbait/gossip, specifically fabricated claims in videos that he is Suing The View for $50M. This misinformation is spread by satirical websites and social media.
Ariana Grande’s content has shifted from “Pop Star” to “Movie Star.” Her current narrative focuses solely on professional film promotion—interviews, press looks, and co-star relationship—rather than her music.
Taylor Swift’s release of “The Life of a Showgirl” was the primary driver for Taylor Swift’s 28.29% increase in video uploads.
Source: Touchstorm DATAlabs
Note: Data reflects “earned” content (videos about/featuring each artist). Periods: Pre (7/27/25–9/27/25) vs. Post (9/28/25–11/29/25). Data includes the ten artists with the largest % difference.
TRACKING THE HYPE
Videos Per Week
This timeline tracks the weekly volume of “earned” videos (content created by fans and third parties) to pinpoint the exact events that triggered surges in conversation.
Kendrick Lamar (Week of 2/10/2025): Reached the highest peak with 10.6k videos, likely driven by the 2025 Super Bowl.
Lady Gaga (Week of 4/28/2025): Saw 4.3k videos, coinciding with the Joker: Folie à Deux release and her album cycle.
Taylor Swift (Week of 8/25/2025): Peaked at 8.5k videos, tied to the Eras Tour and pre-album hype.
Bad Bunny (Week of 9/29/2025): Experienced a notable surge to 3.6k videos immediately following the Super Bowl 2026 announcement.
Ariana Grande (Week of 11/17/2025): Peaked at 3k videos, influenced by the Wicked movie release cycle.
Source: Touchstorm DATAlabs
Note: Data reflects “earned” content (videos about/featuring each artist). Weekly periods are Monday–Sunday.
FINAL TAKEAWAYS
WHAT THE WORLD’S LARGEST FOCUS GROUP REVEALED
Was Bad Bunny the right choice for the Super Bowl Halftime Show? The answer depends on what you value most: domestic ubiquity or global devotion.
While Spotify tracks listening habits, YouTube tracks cultural bandwidth. The data presents Bad Bunny as a titan of “Intent.” Unlike peers who rely on the passive discovery of Shorts, Bad Bunny dominates Longform video (10.3% Global share). This indicates a fanbase that doesn’t just stumble upon content, but actively seeks it out, a crucial trait for a live broadcast event.
When stacked against alumni, Bad Bunny’s distinct advantage is his “Global Except US” dominance. While Bruno Mars appears to have an outsized showing in the data, this is largely driven by high-profile collaborations with ROSÉ and Lady Gaga that technically count as “earned” viewership. In contrast, Bad Bunny offers the NFL a direct line to a diverse, international audience that traditional US pop stars may not capture as effectively.
Taylor Swift and Ariana Grande may rule the “Shorts” feed, but Bad Bunny rules the “Watch” time. He brings a massive, high-intent, global audience that doesn’t just scroll past. They tune in.
Finally, the announcement itself triggered a 4.7x surge in user content, proving he is a cultural catalyst capable of driving conversation.
Does the value of a high-intent, globally diverse fanbase outweigh the viral volume of other contenders? We’ve presented the evidence. Now, you decide.
For any feedback or questions regarding this report, please reach out to us at badbunnyreport@touchstormDATAlabs.com.
You've seen what creator coverage can reveal.
Now you can get this intel for your brand every month. Powered by the creators already talking about you on YouTube.
Fill out the form and get your first report free ↓
One-off Insights aren’t enough
Moments like a campaign launch or creator collab generate spikes in attention, but that’s not the full story. You need to see how brand perception builds, shifts, and compounds over time.
Brand Buzz Monitor
Tracks YouTube creators every month to reveal how your brand is being mentioned and compared with your competitors.
What You Get
- Clear, structured view of creator coverage
- Insights ready to share and act on
- No more piecing together individual videos
See How Creator Buzz Is Building Around Your Brand
Add up to Nine Competitors
By signing up, you agree to our Terms and Privacy Policy .

Thank you for requesting your
first Bad Bunny report.
from reports@touchstormdatalabs.com
with everything you need to know.
SENTIMENT AT THE VIDEO LEVEL
Negative sentiment over-indexes on views relative to volume. Negative videos represent only ~22% of videos but ~31% of total views, suggesting controversy-driven amplification.
YouTube Shorts are disproportionately neutral, often framing the topic as news, jokes, or reaction clips rather than opinionated takes. Shorts inflate video count, especially in neutral sentiment, but Longform drives total watch time and influence.
Positive sentiment dominates attention, not just volume. Positive videos account for ~55% of all videos and ~56% of total views, indicating alignment between creator output and audience interest.
Source: Touchstorm DATAlabs
Note: Sample of 4,105 videos published in the nine weeks post-announcement.
VIDEOS LEADING THE CONVERSATION


Positive videos emphasize respect from other artists, comedians, and industry voices. Longform podcasts are disproportionately represented among high-view videos with positive opinions. Furthermore, positive videos often reframe Bad Bunny’s global dominance as already mainstream in the US, effectively countering claims that he remains "niche."


Neutral videos mainly explain the controversy, summarize reactions, or feature clipped moments without taking a definitive stance; many of these videos are observational or comedy-adjacent. A significant portion of these are Shorts, which tend to focus on commentary about the discourse itself rather than expressing opinions within it.


Negative videos focused on the NFL's audience fit, language barriers, and the halftime show's purpose, not his talent. Negative, high-view content often positioned the artist in identity and generational culture wars, driving engagement by what he represents over his music. This negative sentiment typically appeared in short videos, unlike positive commentary which sometimes utilized Longform podcasts.
Source: Touchstorm DATAlabs
Note: Sample of 4,105 videos published in the nine weeks post-announcement.
NARRATIVE DEEP-DIVE: WHAT ARE THE PEOPLE SAYING?
Many positive comments express intent to watch the Super Bowl or Halftime show because of him, even from non-football fans. This positivity is strongly driven by pride and representation, as fans frequently frame his selection as a win for Latino representation, recognition of global music influence, and validation for Spanish-language artists on mainstream US stages. Fans position Bad Bunny as already mainstream, citing his streaming dominance, sold-out tours, and cross-genre/cross-language appeal. The overall tone is one of low defensiveness and high confidence, characterized by clear, declarative support.
positive comments


neutral comments


Neutral comments serve as social commentary rather than opinion, aiming to contextualize a discussion without taking sides. These comments often observe reactions, note demographic divides, or explain the controversy itself, media reaction, or whether backlash is overblown. They are typically longer, calmer, and less emotionally charged, indicating thoughtful cognitive engagement rather than an affective response to the artist or subject matter.
Negative comments often stem from "Cultural Friction & Audience Mismatch" rather than criticism of his ability. The opposition focuses on language barriers, perceived mismatch with the NFL's traditional audience, and a preference for legacy acts. This critique is often framed as a "zero-sum" loss for the core audience, driven by strong emotional and absolutist language, suggesting a reactionary sentiment. Ultimately, the strongest negative reactions reflect deeper discomfort with cultural change, demographic shifts, and the globalization of US entertainment, rather than just an objection to Bad Bunny himself.
negative comments


Source: Touchstorm DATAlabs
Note: Sample of 41,316 comments from top-performing videos in each sentiment category.
