
2025
Political Sentiment

MOST RECENT PUBLISHING DATE: March 30, 2025
Updated data and new analyses will be added on or before April 8th, 2025
We've turned YouTube into a
Daily, Ongoing Political Poll
With a Sample Size of 80,000,000+
The Independent Media Stars of the Pro-Democracy Movement
YouTube is the de facto home of Independent Media, a booming contemporary class of intellectual pundits and loud-mouths alike who use YouTube’s lack of broadcast time constraints to deliver more explanatory and contemplative content. This same group has harnessed the platform’s cost-free distribution and sharing tools as its preferred launchpad for their infectious crafted productions as well, all while having a two-way conversation with potential voters.
The biggest names in Washington regularly do interviews with Indy Media hosts now.
Comparing the Top 20 MAGA voices to the Top 20 Pro-Democracy voices reveals that the Pro-Democracy Independent Media channels have gotten 62% of the views since the Inauguration, whereas the MAGA Independent Media channels received 38% of the views.
Scroll down on the chart itself to see beyond the Top 20.
Source: Touchstorm DATAlabs. Geography: United States. Data Range: Jan 20, 2025 – April 20, 2025. Producer Types: Independent/Digital Media Companies, Creator Makers (Video Producers), Creator Vloggers (Commentators not big enough to be called Indy Media), Creator Curators (those who gather TV and Online Political Clips but don’t add commentary), and Non-Profits who make online content.
About this RESEARCH
ABOUT US
Touchstorm DATAlabs is a private, woman-owned, self-funded subsidiary of Diginary Holdings, LLC. It’s a sister company to Touchstorm, our managed services company that runs YouTube channels for some of the world’s biggest brands. DATAlabs customers include Google, Amazon, ClickUp, Exness and Mozilla. Touchstorm clients include Toyota, T-Mobile, J&J, Bosch, various media companies and brands owned by multinational marketers including P&G and Bacardi. We’ve been in business nearly 30 years.
Touchstorm DATAlabs has a singular ability to transform YouTube into the World’s Largest Focus Group, revealing societal perceptions and marketing insights impacting any conceivable human activity, anywhere. By replicating, structuring and appending YouTube’s database, we enable YouTube Social Listening, Custom Perceptual Studies (like our political polling), Behavioral and Trend analysis, Competitive Tracking, Influencer Analysis and Automation, eCommerce Reviews, APIs for data aggregation and ratings for unrated industries like gaming, music & podcasting. We also offer a SaaS platform for anyone looking to improve their YouTube performance.
We welcome all questions and feedback at politics@touchstormdatalabs.com.
METHODOLOGY
Our methodology begins with the daily importing of every new video uploaded to YouTube – about 5mm a day. Every night, those new videos enter our database along with ~40 standard metrics provided by YouTube. Those metrics are refreshed every day from then on.
We then sort videos by Topic and categorize them to the Touchstorm Video Index (the TVi), our taxonomy. The TVi houses about 200,000 nested Topics that cover every aspect of the human experience in incredible detail.
To measure political perceptions, we run the transcripts of all US Political videos through AI. The system brings back four major types of videos: Neutral, Conservative, Liberal and Mixed. Within those, another round of AI puts them into narrower buckets like Pro/Anti-Trump, Pro/Anti-Musk, Pro/Anti-issues such The Economy, Character, Foreign Policy and more. Moving forward, we’ll be exposing more of those breakouts.
Following AI classification, a two-person Quality Control team (one Democrat and one Republican) reviews the AI selections for all videos with more than 500,000 views. Despite the AI’s accuracy, we
learned early on that even
though millions of videos comprising the analysis set, certain types of videos have the ability to skew our results. For example, paid campaign ads will always be Pro-Candidate, but including those means we’re measuring spending instead of pure Confirmation Bias. Another example is good-natured humor. It may pick on or inflate Trump, but people might be watching incidentally instead of watching in a way that exhibits Confirmation Bias.
Please address questions and feedback to politics@touchstormdatalabs.com.
WHO MAKES VIDEOS
More than 22,000 YouTube channels based in the United States publish political content that makes up more than 75% of everything they publish.
Those channels originate with YouTube’s panoply of contributors: national TV news networks, local news stations, political parties, elected/appointed officials, TV programs, professors, religious institutions and leaders, celebrities, newspapers, social scientists, columnists, associations, attorneys, political strategists, PACs, comedians, magazines, Independent Media, vlogger pundits, and everyday citizens.
And of course, YouTube is the home of the fast-growing group of content makers labeled Independent Media, which our research ranks and studies (see charts below).
Please address questions and feedback to politics@touchstormdatalabs.com.
POLLING VOLUMES
For this particular analysis, we began measuring viewing the week before the January 20, 2025 Inauguration. As each week goes by, more videos on US Politics are published. The subject matter is news-oriented which usually has a shorter shelf-life, yet we’re surprised at how many people are watching January political videos in March. It appears people are playing catch up.
We’re measuring the attitudes on every political video, new and old. As of the March 31st edition, the sample size on Trump alone is more than 300,000 videos generating 7.7B views since mid-January, reaching more than 80mm people.
Please address questions and feedback to politics@touchstormdatalabs.com.
INTERPRETING THE RESULTS
This is not a traditional poll. We’re not asking people who they will vote for. Instead, we’re observing which political videos people are choosing to watch.
Our backgrounds are marketing and technology. In the marketing business, much is written about forward-looking surveys vs. documenting actual behavior. For example, asking people if they’d like to buy a Mercedes this year will produce high and hopeful results that won’t resemble backward-looking measurement of who and how many people actually bought a Mercedes. Traditional political polls look forward…who will you vote for if the election was held today? Our research looks backward at documented behavior; in this case, what videos did people choose to spend time with?
YouTube is a “lean-forward” medium where each viewer makes custom selections about which videos to watch. Political videos are driven by Confirmation Bias, the psychological phenomenon positing that humans seek out information consistent with their existing beliefs, while ignoring information contrary to those beliefs.
Politics is the poster child for Confirmation Bias, because the behavior is most evident with emotionally charged issues where beliefs are so entrenched that people crave a specific outcome. We’re making the easy leap that Pro-Trump Videos are being watched primarily by Trump/Vance supporters. Understanding this is key to properly positioning these numbers in Our reporting.
Indeed, each video may attract an insignificant number of the genuinely enlightened or intellectually curious. And surely, each video attracts a handful of trouble-making trolls who insert inflammatory comments just to entertain themselves. But big picture, stats such as “Like Ratios” and ”Contrarian Commenting” reassure our data scientists that Confirmation Bias on these videos is more than 95% pure, meaning, it’s hard to find Anti-Trump people watching Pro-Trump videos and vice versa.
Please address questions and feedback to politics@touchstormdatalabs.com.
The Independent Media Stars of the MAGA Movement
The MAGA channels aren’t doing as well as they’ve done for most of their history. In March 2025, the top MAGA channel was bested by the top Pro-Democracy channel by a more than a two-to-one margin.
Scroll down on the chart itself to see beyond the Top 20.
Global YouTube Demographics vs. USA Demographics
Source: Touchstorm DATAlabs.
Typically, pollsters apply weighting to survey results so final polls reflect the American population. From a statistical standpoint that’s the right thing to do. In practice, however, it can magnify oddities. In a survey of 1000 people for example, if W18-24 represent 10% of the population but only 5% of the returned surveys, the W18-24 surveys must be doubled in weight. That’s fine if the 50 W18-24 surveyed were prototypical, but that’s not always the case.
Our sample doesn’t require that weighting, but still, the statistically-minded should be wondering if YouTube itself is representative of American society. Here’s the answer.
Tesla Views
Tesla is getting half the YouTube views it did a year ago. We recently completed an EV car study for the world’s #1 automotive brand, so we can say with confidence that EV views are growing rapidly on YouTube, and people’s perceptions of EVs are becoming more positive. Just not for Tesla.
Source: Touchstorm DATAlabs.
Until Next Week
Presidents 60 days into their term average a Net Favorability Score of +27. For the week ending March 30th, we show Trump at -41 and Musk at -45. That’s a high-drama difference.
As a country, we’ve lived through some drama, but never anything akin to what’s happening now. Seeing extraordinary numbers during extraordinary times probably shouldn’t be so surprising.
More in a few days – please check back often. We welcome all feedback and special requests at politics@touchstormdatalabs.com.
Pro-Democracy Voices Now Outshine MAGA Voices On YouTube
Conservative media has out-shouted liberal media since 1953, long before Rush Limbaugh took to the airwaves. Today, the data shows people are paying much more attention to the “liberal” voices.
Since Inauguration Day, the Top 3 Independent Media Channels on YouTube have been Pro-Democracy, pushing some very well-known MAGA commentators way down in the rankings.
When isolating the analysis to the Top 20 Indy Media Channels between mid-January and March 30th, Pro-Democracy channels attracted twice as many views as MAGA channels.
A note regarding our labels. We don’t call the “blue channels” Democrat or even liberal because sometimes the creators behind them aren’t Democrats or liberals. Many are Republicans or Independents, often warning of autocracy, are only blue because they’re Anti-Trump. Similarly, traditional Republicans say that today’s right-wing pundits don’t represent Republican ideals; they subscribe to MAGA values instead. Like it or not, we’ve had to acquiesce to calling red channels “MAGA” and blue channels “Pro-Democracy.” For those just making their way here from Mars, MAGA is Pro-Trump and Pro-Democracy is Anti-Trump.
Scroll down on the chart itself to see beyond the Top 20.
Source: Touchstorm DATAlabs. Geography: United States. Date Range: Jan 20, 2025 – April 20, 2025. Producer Types: Independent/Digital Media Companies, Creator Makers (Video Producers), Creator Vloggers (Commentators not big enough to be called Indy Media), Creator Curators (those who gather TV and Online Political Clips but don’t add commentary), and Non-Profits who make online content.
Ratings, Reviews, Social Listening, Custom Research and a YouTube Saas Platform.
The technology, data, and software that drive Touchstorm’s full-service YouTube strategies are available in our all-in-one YouTube platform, Touchstorm DATAlabs.
Touchstorm DATAlabs unlocks the insights, provides the tools, and creates the access for agencies, media conglomerates, and internal social media teams to grow audiences and earnings on YouTube independently.
We offer ratings for Music, Gaming and Podcast as well as Custom Perceptual Studies. We license Product Review Montages for brand use on Amazon, WalMart and more. We have the only Social Listening and Keyword Optimization tools for YouTube. Our Topic Finder and Trends tools reveal content holes on YouTube.
Whether you need YouTube-specific help or an understanding of any marketplace, Touchstorm DATAlabs has the tools to help.
It’s Time for Disruption in the Polling Industry
Pollsters who use phone and online surveys show Trump’s Net Favorability Score between -11 and +8. Those polls have four-digit sample sizes. Our method, with a sample size of more than 80mm, shows that Trump’s Net Favorability Score is significantly worse: he’s -40.5 points underwater this week and -36.8 last week. No doubt, our research has some shock value. It’s a paradigm change. Below, we’ll show you exactly why these numbers are worth believing.

It’s the Political Off-Season, but Look At View Volume
For nearly a year, we’ve been tracking the shifting attitudes of billions of people worldwide and hundreds of millions in the US. We use data, technology and AI to measure anonymous-yet-documentable video viewing choices on YouTube.
This chart demonstrates how many views US Political content gets on YouTube. The knowledge-hungry are heading to YouTube for in-depth US Political information in record numbers. March 2025 YouTube viewing for the US Politics Topic is so astronomical – almost eclipsing Election Month – that liberals alone couldn’t generate the activity. What’s going on? Perhaps March is the month it became clear there’s much more at stake than most of us perceived on lever-pulling day.
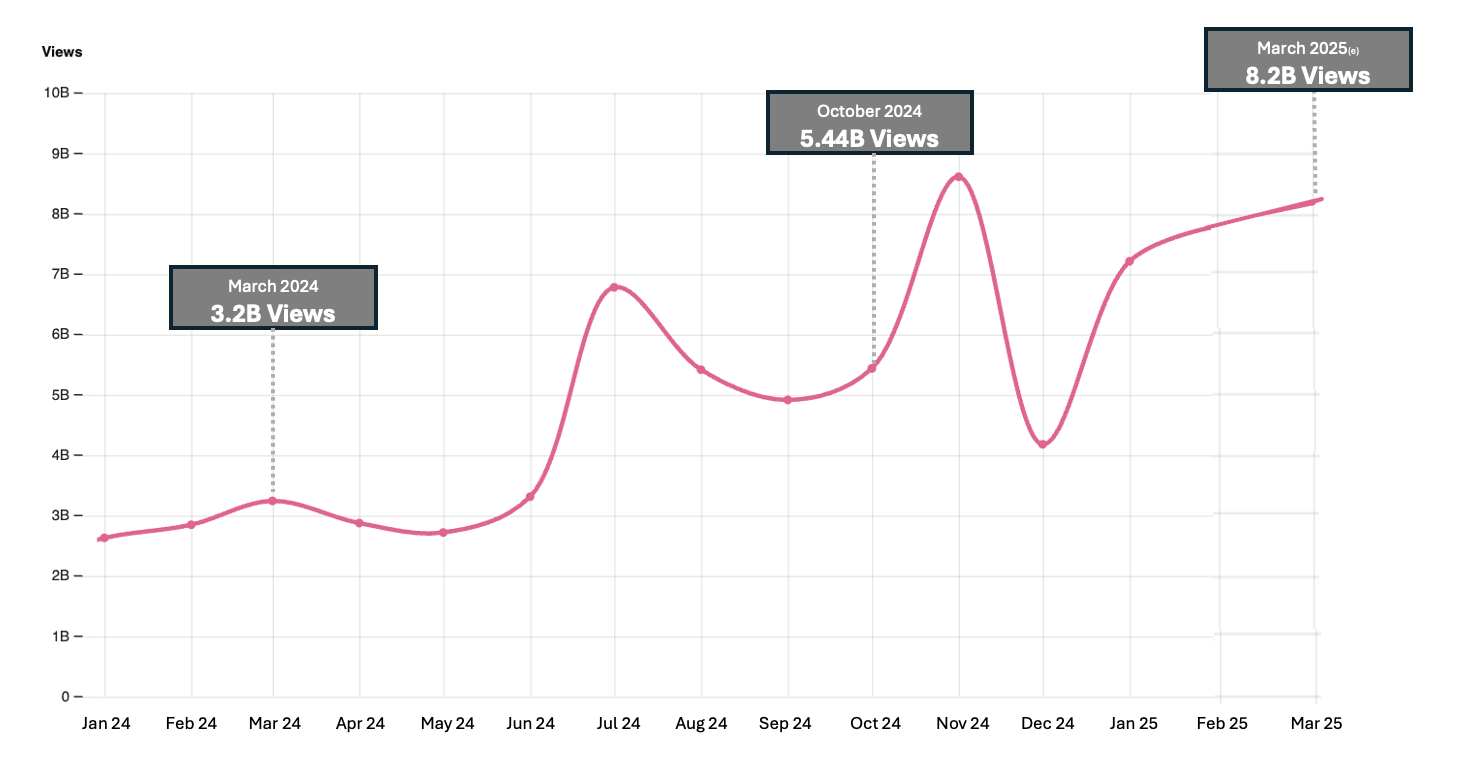
Source: Touchstorm DATAlabs.
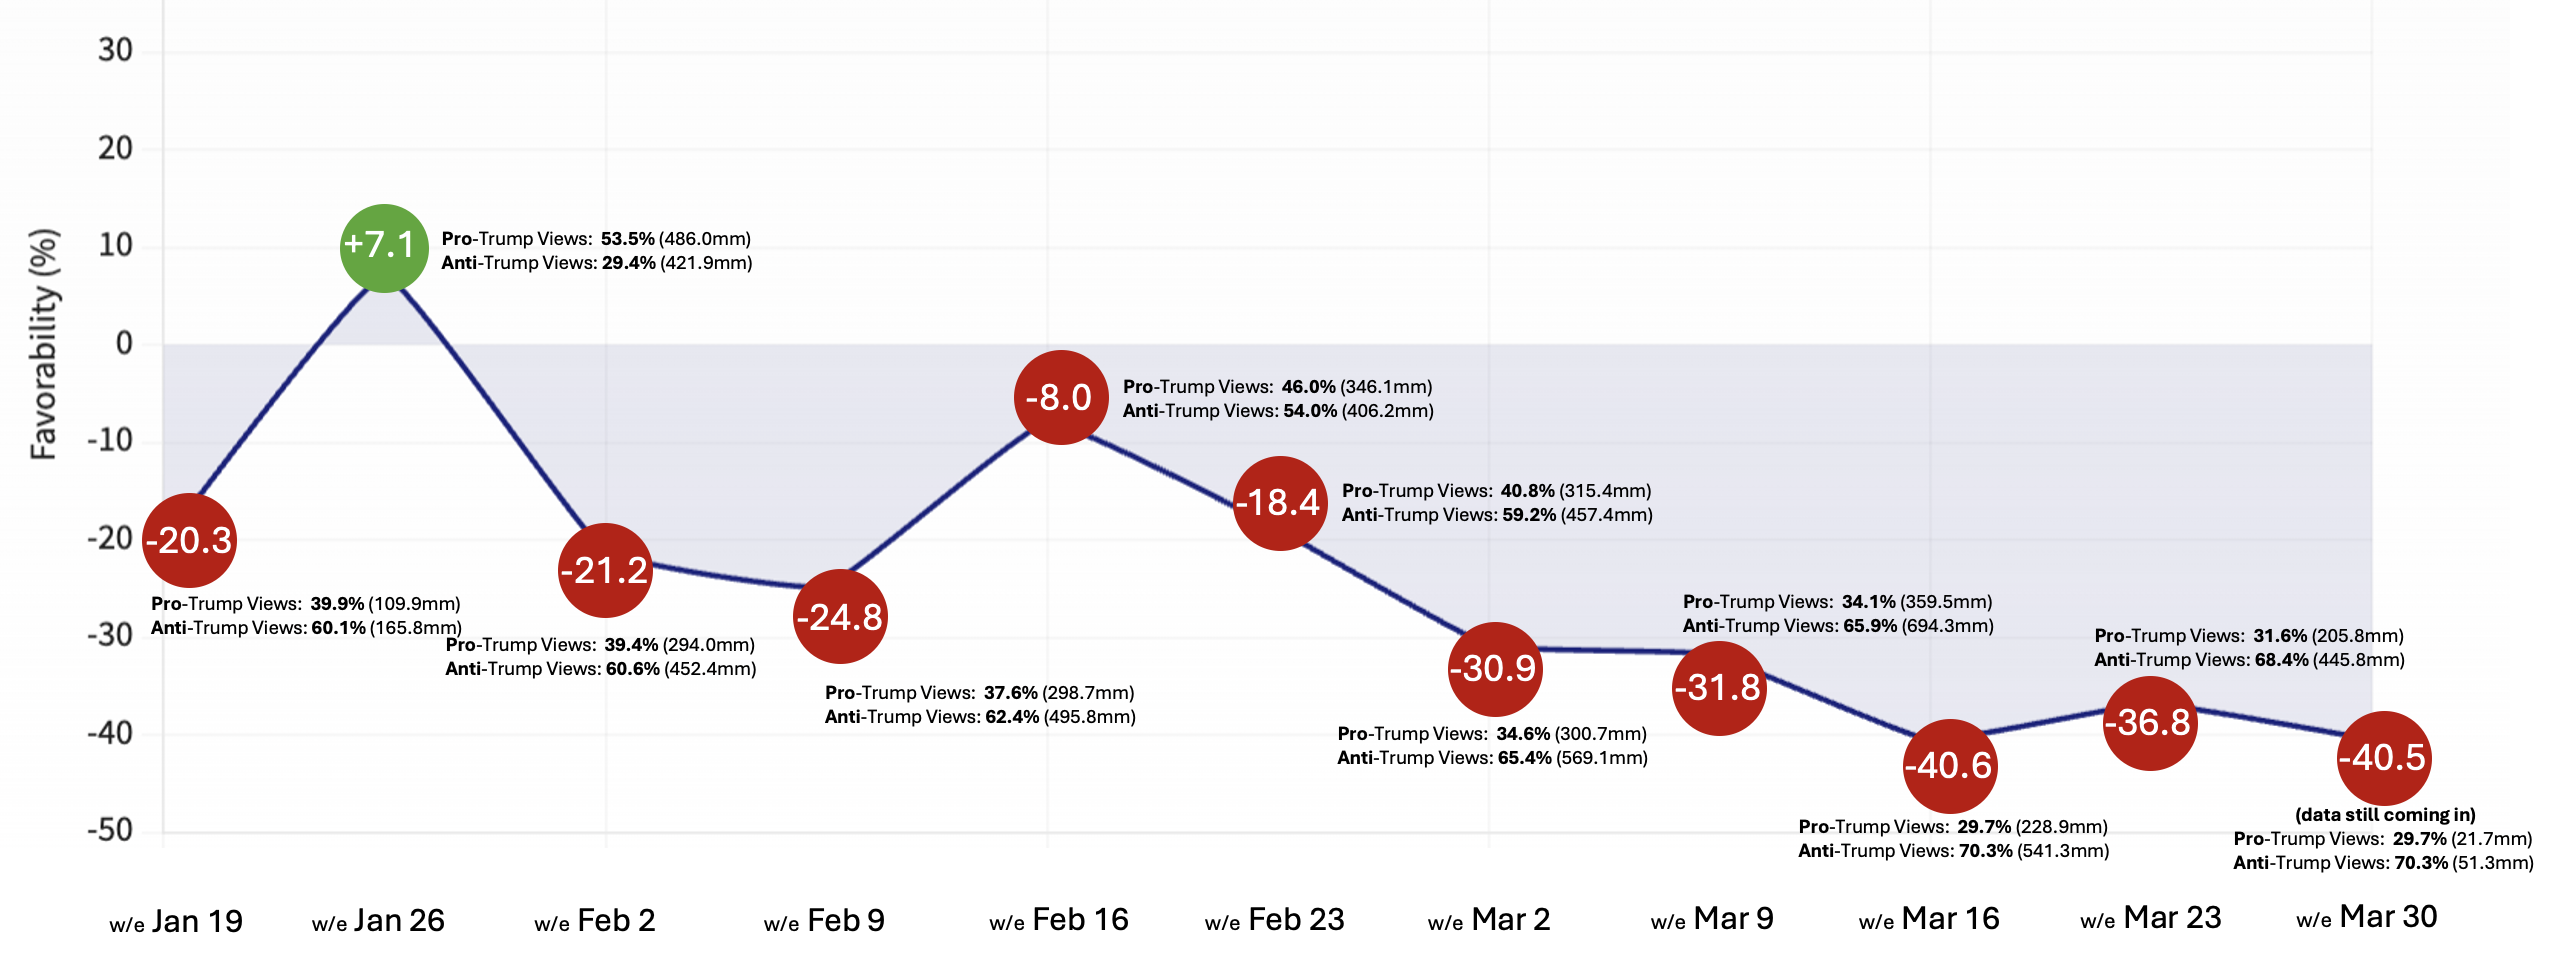
Note: Favorability Score (same as traditional polling): % of Pro-Tump Viewing minus % of Anti-Trump Viewing. Sight differences in Favorability Scores are due to rounding.
Large sample size = 0% margin of error. We bear all responsibility for results; neither Google nor YouTube participated in nor sanctioned this report.
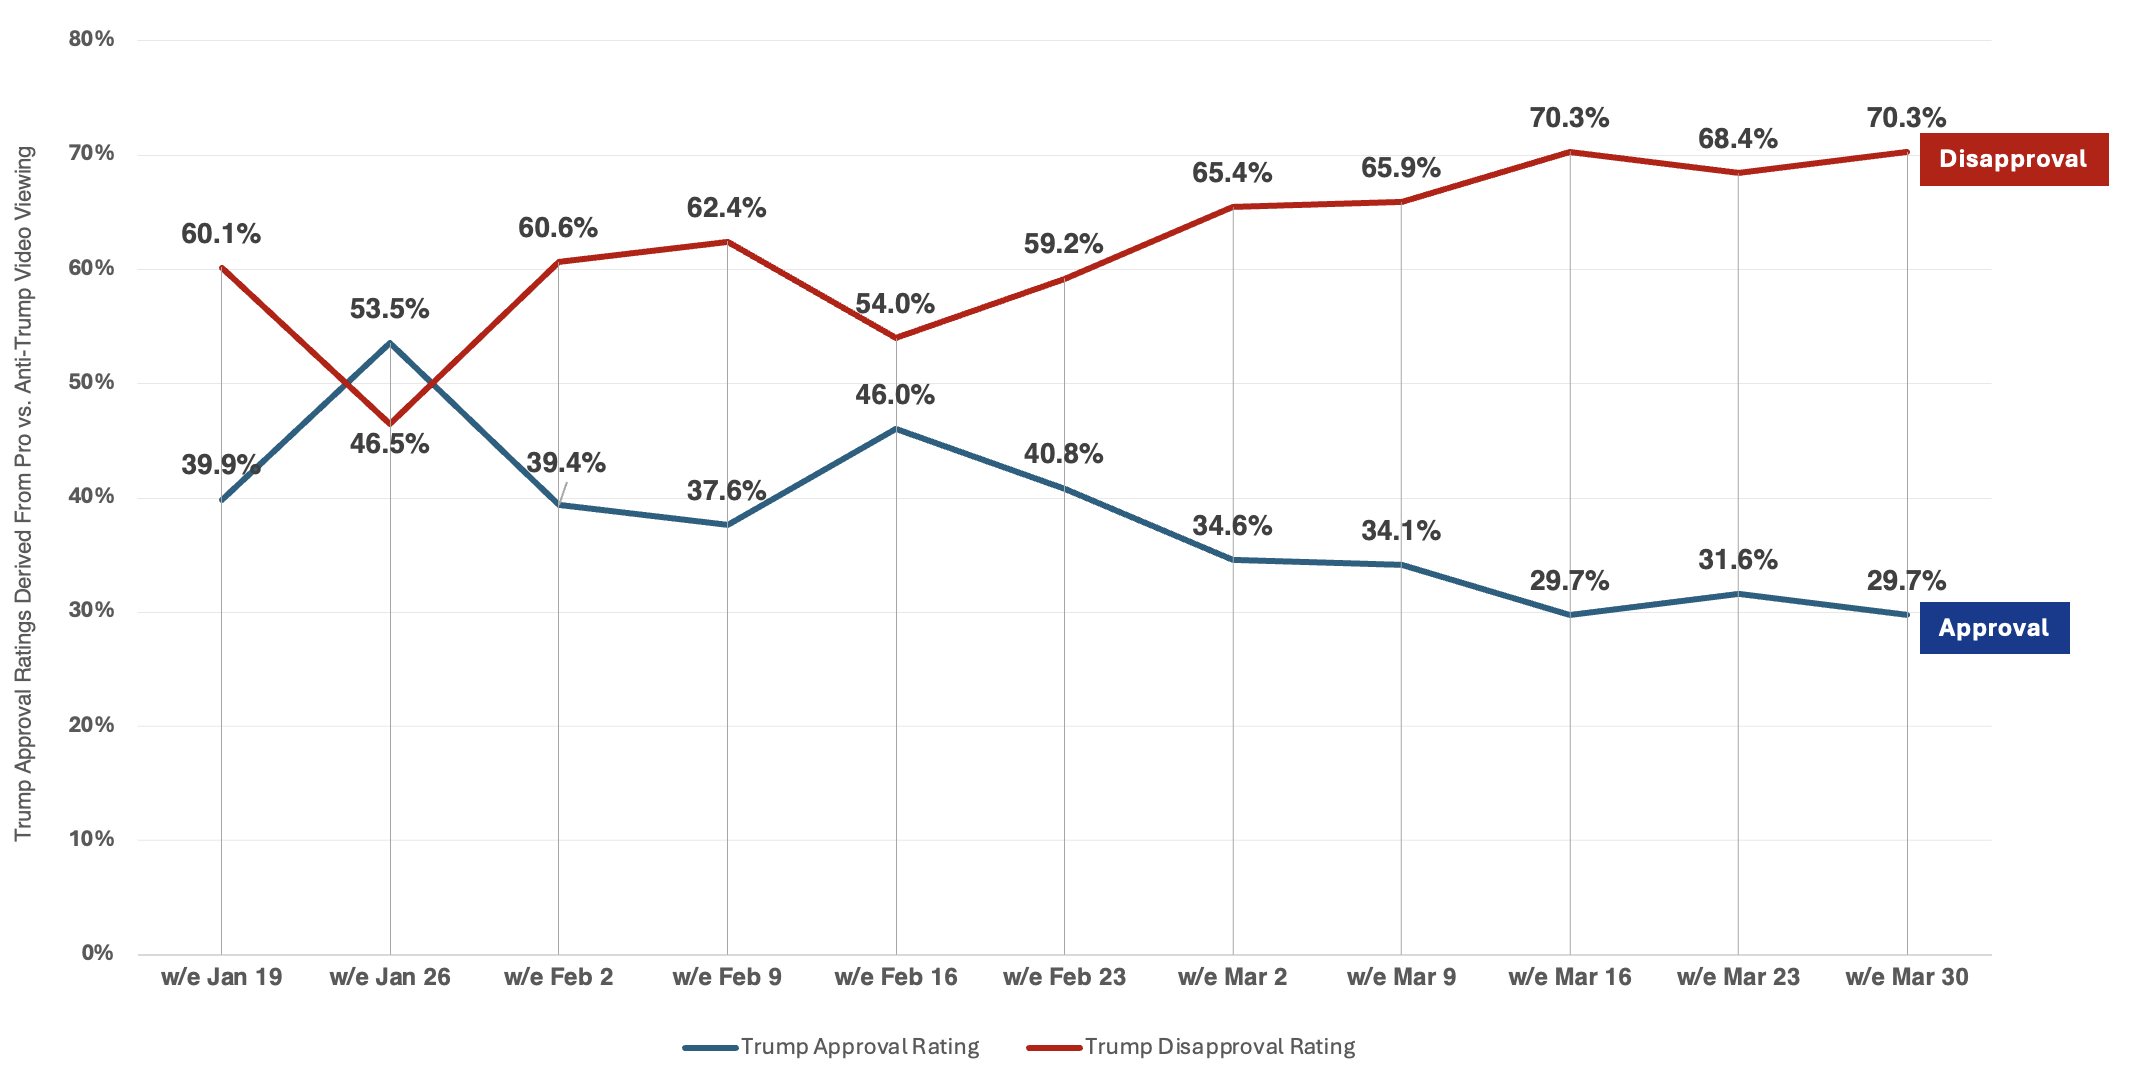
Trump's Approval Rating Is Less than 30%
In early Summer 2024, 65% of US Political YouTube viewing went to positive Trump content, and only 35% went to negative Trump content. If we drew this chart then, you would have seen a 65% Approval Rating for Donald Trump.
Now, opinions have flipped a near 180-degrees over last summer. Today, 70% of US Political YouTube viewing is Anti-Trump and 30% is Pro-Trump. In our methodology, that registers as a 70% disapproval rating for President Trump.
As shocking as that number may be, it roughly aligns with a Fox News poll released only days ago that says 70% of Americans dislike Trump’s tariffs. If America was still in the same mood as it was on Election Night, when the difference between Trump and Harris was only 1.6%, this chart would render closer to 50/50. Instead, the country’s mood has demonstrably changed.
Trump's Net Favorability Scores are Deep Underwater
Our methodology puts all US Political videos through AI to determine sentiment around a stated thing. In the charts above and below, President Trump is the stated thing. AI sorts the videos into Pro-Trump and Anti-Trump. Then our technology adds up the views on each.
Subtracting the disapproval rates from the approval rates produces a Trump Net Favorability Score of -40.5, much lower than the traditional polls. Elon Musk’s Net Favorability Score for the week ending March 30, 2025 was -45.4. We will publish more Elon Musk numbers next week.
Confirmation Bias works overtime in politics. People simply will not watch messages that don’t ring true to them. Because liberals alone could not account for 70% of the views, we interpret these numbers to mean that some Republicans are changing their minds as the administration starts to affect their lives. It would take a lot to generate the severe swing measured between last summer and now. How does the public move from 65% approval to 70% disapproval in less than a year? The anger on display in Town Halls and street protests might provide a clue. Our data reveals an emotional intensity resulting in 40% of MAGA enthusiasts leaving their deeply entrenched positions behind.
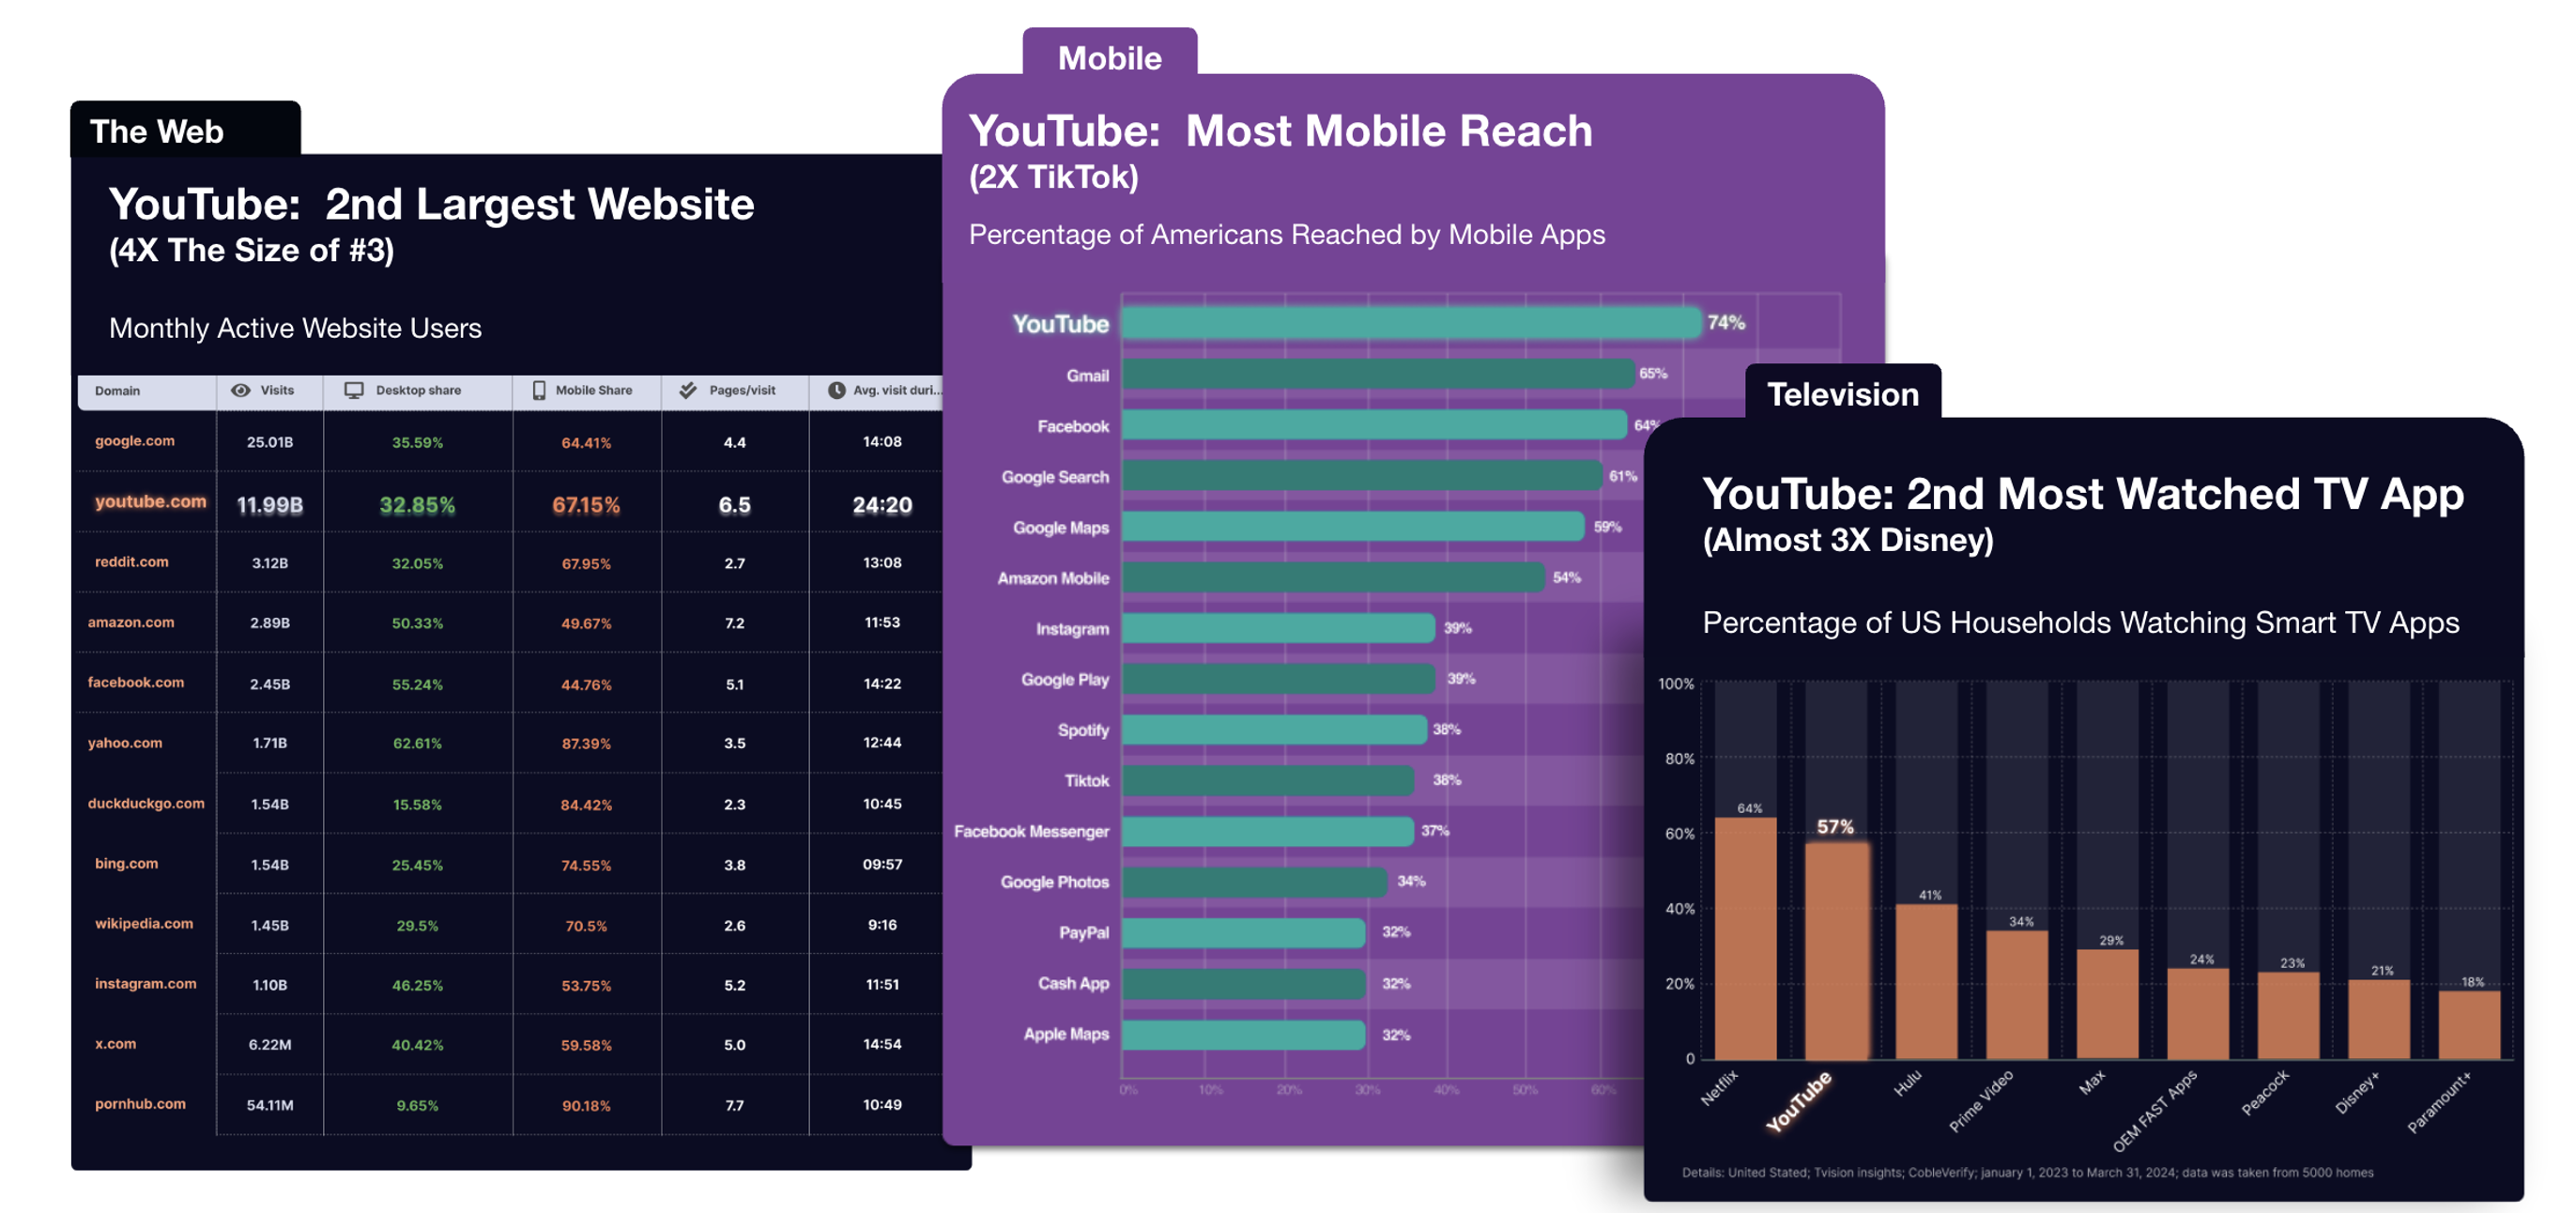
We’ve Turned YouTube Into the World’s Largest Focus Group
Our data begins with YouTube videos. That’s because YouTube beats all other mediums for audience, hands down. And with 7.7B views on US Political Trump videos since mid-January 2025, YouTube is the place where the bulk of the political conversation unfolds.
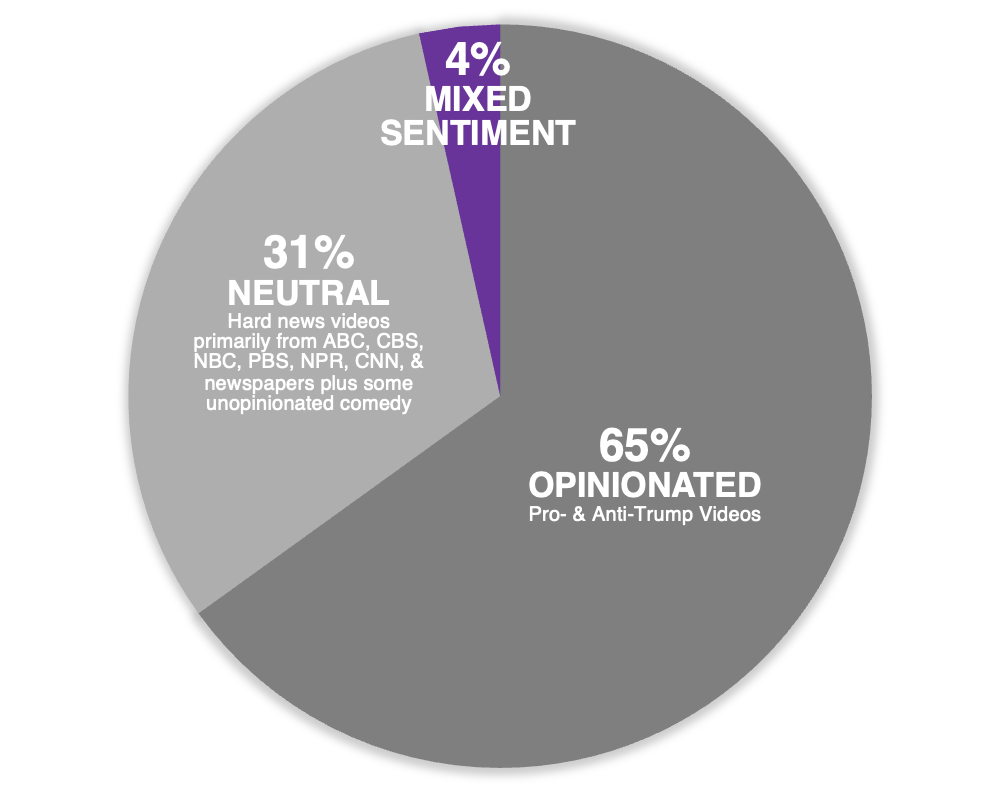
The Types of Videos in Our Research
Every week, ~30,000 new videos discussing Donald Trump are uploaded to YouTube.
Those videos fall into four buckets:
- Pro-Trump
- Anti-Trump
- Neutral (Hard News or Comedy)
- Mixed Sentiment
Opinionated content (Pro and Anti Trump for a Trump analysis) typically comprises 65% of what’s uploaded to YouTube, setting those videos up to attract like-minded people.
We’re also running this exercise against other elected and appointed officials, including Elon Musk, which we will publish by April 6th. We also analyze the administration against specific issues like The Economy, Foreign Policy and Immigration. Those, too, will be added next week.
Democrats Are Hauling in the YouTube Views
Source: Touchstorm DATAlabs. Producer Type: Elected or Appointed Official. Geography: United States. Date Range: Jan 20, 2025 – April 20, 2025.
*Footnote: Bernie Sanders is an Independent who caucuses with the Democrats.
We can also detect the changing mood of the nation by looking at which politicians people are spending time with. Between mid-January and March 30th 2025, Democrats* accounted for eight out of the Top 10 YouTube Channels owned/run by Elected/Appointed Officials. Democrats also account for 80% of the views – numbers eerily similar to the 30/70 approval/disapproval split shown above.
Bernie Sanders, between his two channels, has received 4x the Views of Donald Trump.
Scroll down on the chart itself to check out the rankings for the Top 100 Elected/Appointed Officials.
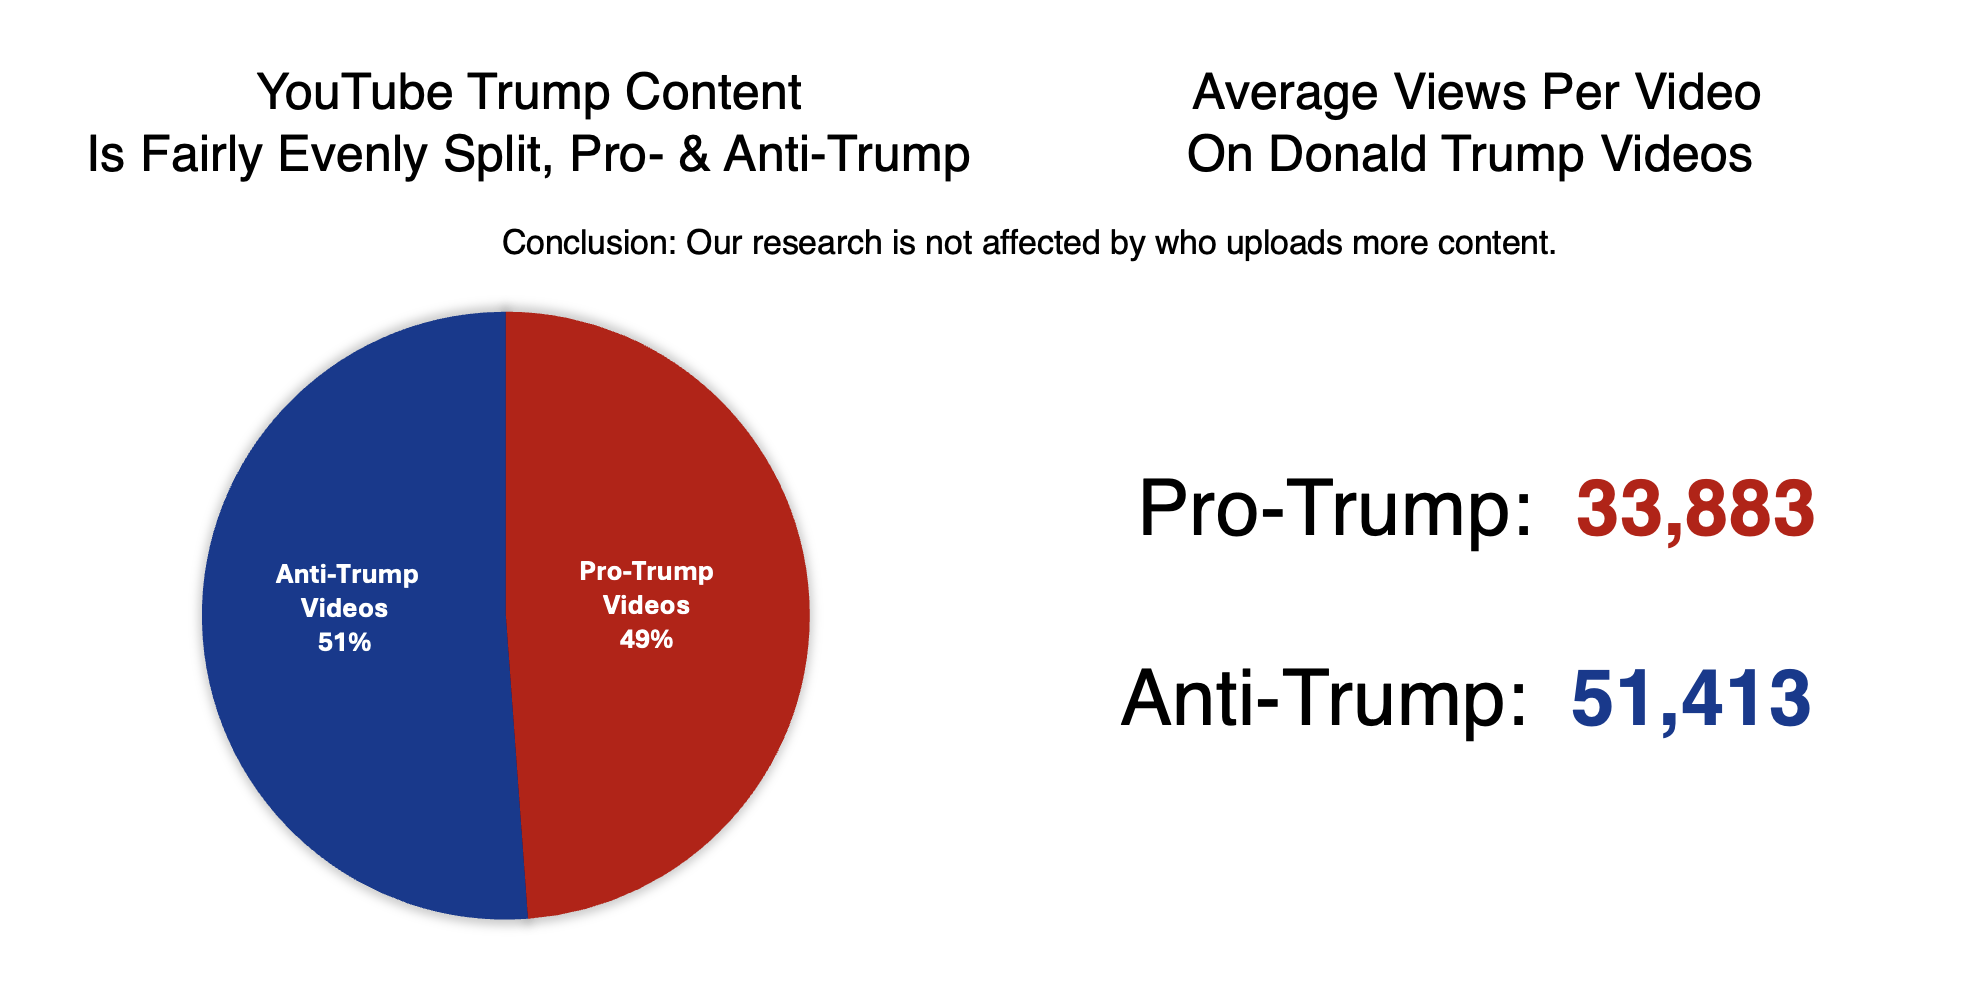
Are Results Skewed by Who Is Uploading?
A fair question about our methodology would be this: is the content uploaded to YouTube overwhelmingly Anti-Trump, hence, results that skew Anti-Trump?
No, that’s not the case. Uploaded content is split down the middle.
But even if it weren’t, average views per video would suss out the story.
Changing Tides: MSNBC Beats Fox on YouTube in March
Fox News and MSNBC produce biased content…Fox on the right, MSNBC on the left. This makes them distinctly different from CBS, NBC, ABC, PBS, NPR and most daily newspapers. AI tells us the national news networks produce mostly unbiased news, with CNN leaning somewhat left.
Between the election in November 2024 and the end of February 2025, YouTube News viewing had been distinctly pro-Trump, evidenced by people watching Fox News more than MSNBC.
But in March 2025, MSNBC on YouTube attracted a bigger audience than Fox News on YouTube.
This is distinctly different from March 2025 cable TV ratings, where Fox beat MSNBC. There are a number of possible explanations for the difference including:
1. Sample sizes: TV ratings are often criticized for their miniscule samples; ours is a “census” study meaning 100% sample sizes.
2. Anonymity: Many households have TV on in the background, making the choice of channel very public. Imagine the dad who says to his wife, “Let’s switch over to MSNBC.” It’s a habit that’s harder to change. By contrast, video viewing is mostly private, allowing people to check out different viewpoints long before they commit to them in a poll or to family and friends.
3. The All or Nothing Effect: When watching Fox News, people can’t choose what’s coming at them. Some stories are pure propaganda; others are news or opinion. YouTube is different. People choose which stories to watch. In March 2025, people chose more stories from MSNBC than Fox.
Source: Touchstorm DATAlabs.
